Flexsim: Simulation Experiment Control
Introduction:
In my previous System Modeling with Flexsim post, I constructed a simulation model using flexsim object like fixed resources, task executor objects, port connections and to introduce variability to the model, I incorporated emperical distributions and visualized the data with dashboard charts. Using this existing model as an experimentation tool we can perform experimentations with various input parameters to influence the model’s performance measures.
Project Overview:
For this we will use experimenter tool, to facilitate this experimentation, we will make use of several tools, including the input table or model parameter table. This table allows us to specify the values of different input parameters that we want to investigate.
Additionally, we will utilize performance measure tables to aggregate and analyze the outputs that we are interested in. These tables help us track and evaluate the performance measures that we define as important for our simulation study.
By employing these tools effectively, we can conduct experiments by modifying input parameters, running the simulation model, and analyzing the resulting performance measures. This iterative process allows us to gain insights into how changes in input parameters affect the desired performance outcomes.
Experimentation:

How can we use this model and learn something about the process and find where are the bottlenecks in the model ?
Experimentation aims to automate the process of changing model parameters and observing their effects on model outputs. The parameters table and performance measure table are designed to formalize the inputs and outputs of interest in the experimentation workflow. By automating this process, experimenters can easily analyze the impact of parameter changes on the model’s outputs. Rather than manually adjusting inputs and observing outputs, the experimenter tool enables users to specify the parameters of interest and automatically track their effects on the desired outputs.
The Experimenter tool facilitates running multiple iterations of a model rapidly, enabling efficient comparison of results and gaining a more comprehensive understanding of the model’s behavior. It automatically generates aggregated output reports, simplifying the process of comparing and analyzing the results. The tool provides valuable information such as average, minimum, maximum, and median values of performance measures, which aids in the analysis of the outputs of interest. These features enhance the ability to assess and interpret the model’s performance more effectively.
Steps to Successfull Analysis
- Prior to conducting experiments, it is crucial to have single run of the model, identifying and rectifying any issues such as extremes, omissions, outliers, or unexpected results to ensure the reliability and validity of subsequent experiments.
- Select a performance measure that accurately represents the purpose or focus of your model.
- Create or choose a new chart on your dashboard to report the selected performance measure.
- Identify the variables of interest that you intend to experiment with and include them in your model parameters.
- Add the Experimenter to your model and create a single Scenario experiment that will modify your Model Parameters.
- View results on “View Results” button on the Experimenter.


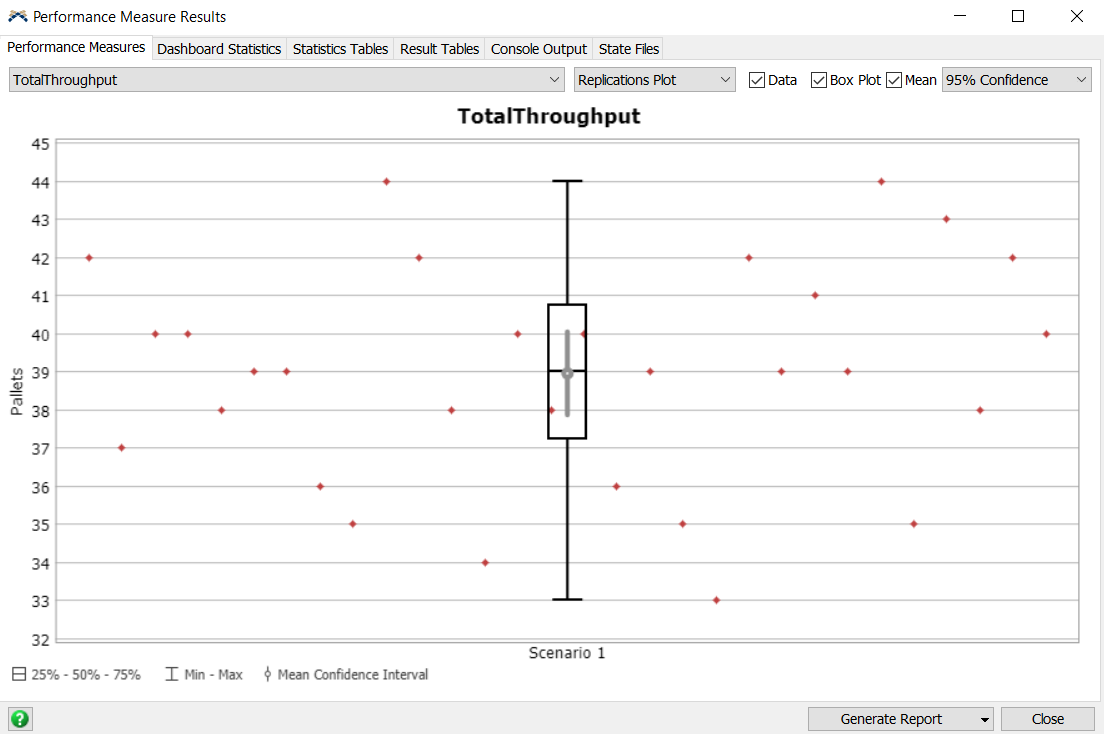
The throughput figure above illustrates the performance of the system, showing that the throughput varies between a maximum of 44 and a minimum of 33. The median throughput value is 39, indicating the central tendency of the data. The calculated 95% confidence interval for the mean throughput is 37.8 to 40.2, giving us a range of values where we can reasonably expect the true mean to fall.
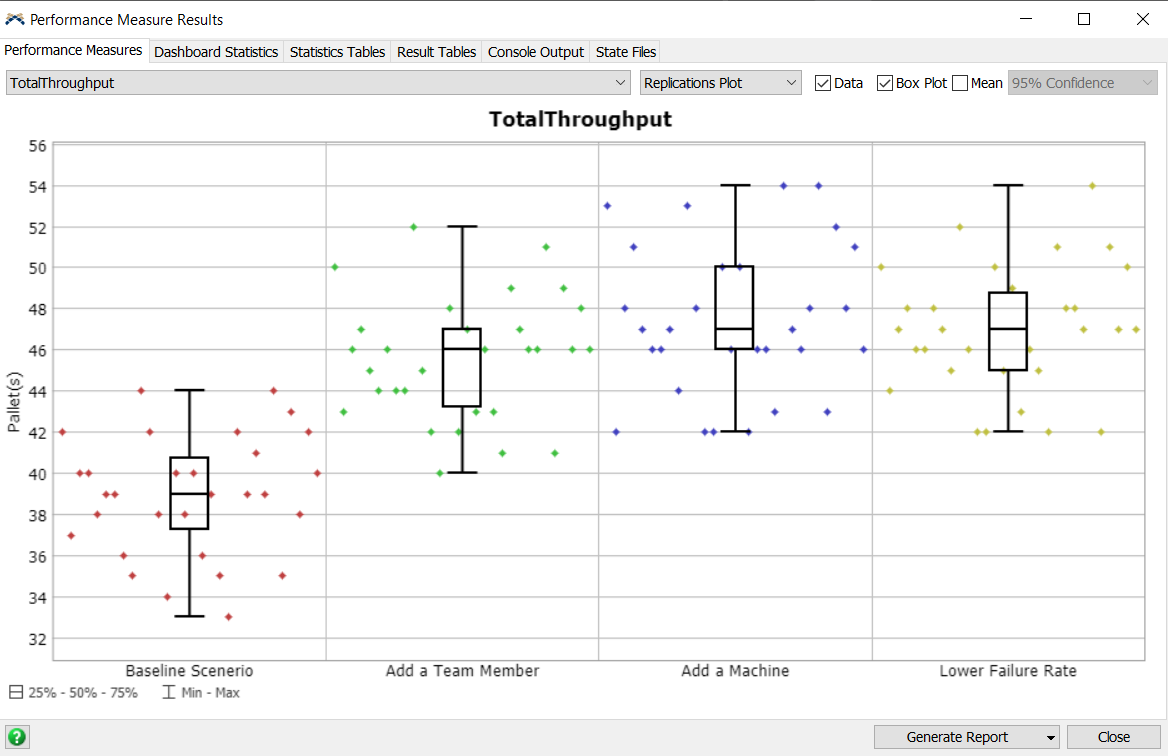
- Define additional Scenarios to evaluate the impact of Model Parameters. Its a good Practice to give scenarios meaningful names for better understanding. Rerun Experiments to see effects of Additional scenarios.


- Create A new Dashboard window and add the Scenario Chart and “point” it to any Charts you have made Examine results for model performance indicators.
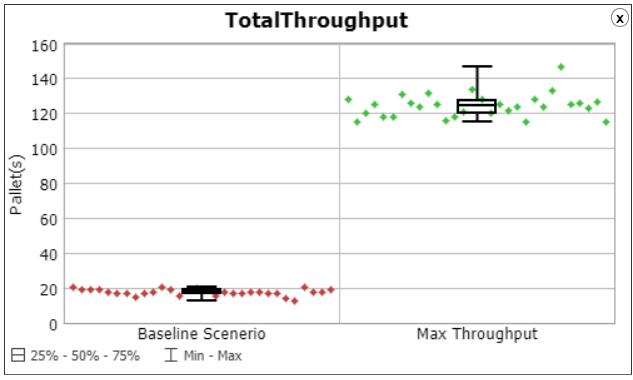
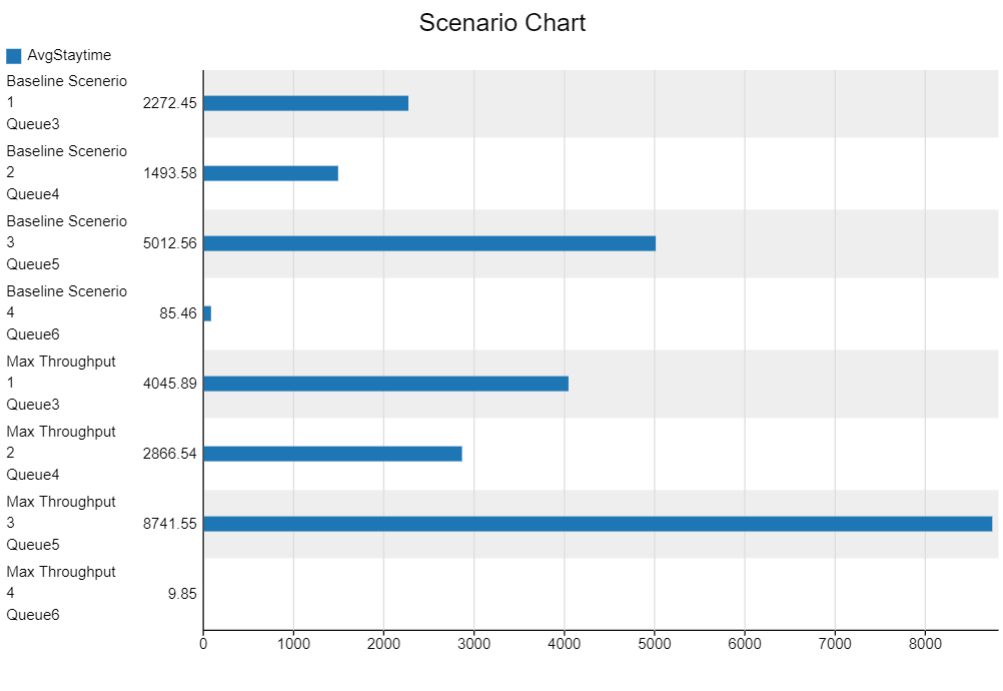
I constructed a scenerio to optimize maximum throughput, involving 3 operator machines and 3 processor machines with a 5% failure rate. After conducting the experiment, the staytime chart highlighted a bottleneck in queue 6, where boxes are delayed before being given to the combiner. Additionally, there is an issue with an excessive number of boxes passing through queue 5. Despite a reduction in staytime for queue 6 in pursuit of maximizing throughput, it became evident that the root cause lies in insufficient items passing through queue 6, negatively impacting overall throughput.
Note: The staytime of a processor is defined as the (time the item leaves the processor) - (time item enters processor).

Scenerio chart for max throughput with avg staytime of each queue in the model.

Conclusion
This project focused on using Flexsim simulation and the Experimenter tool to analyze the performance of a model. By conducting experiments and manipulating various input parameters, valuable insights were gained into the system’s behavior and potential bottlenecks were identified.
Through the Experimenter tool, multiple scenarios were explored, and the impact of parameter changes on performance measures was assessed. This facilitated the identification of critical factors affecting system performance, providing a basis for optimization strategies.
This project highlighted the importance of effective experimentation, selecting relevant performance measures, and utilizing dashboard visualization to facilitate data analysis and decision-making.
Overall, the experience gained from this project enhances the understanding of simulation modeling and experimentation, enabling data-driven decision-making and potential improvements in various real-world scenarios.